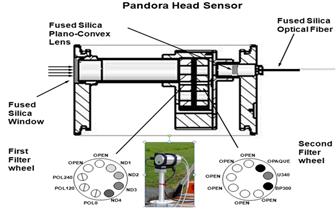
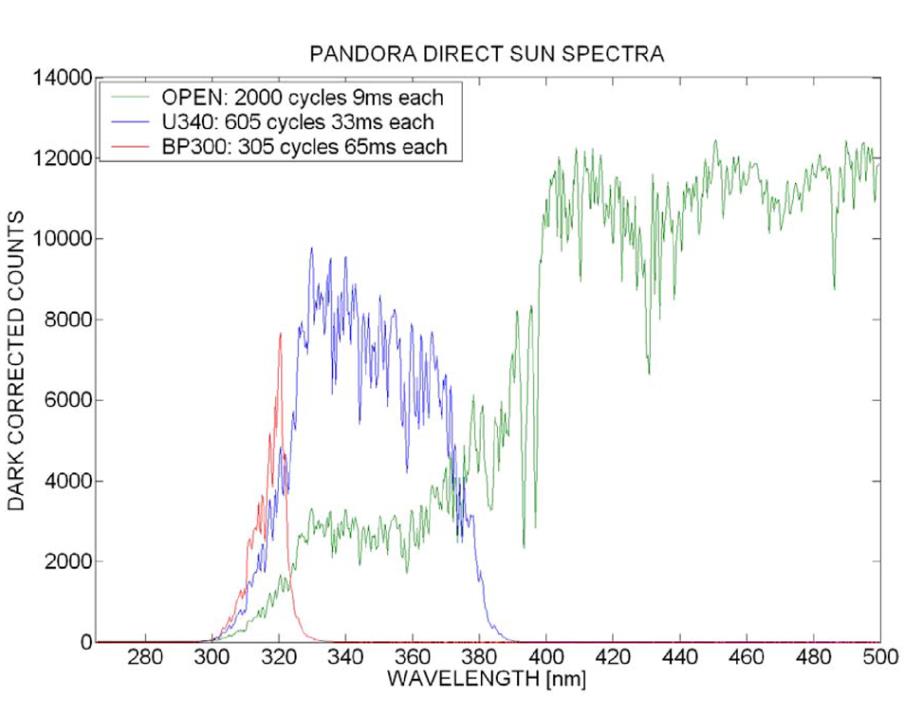
The Pandora spectrometer system uses a temperature stabilized (1OC) symmetric Czerny-Turner system from Avantes over the range 280 – 525 nm (0.6 nm resolution with 4.5x oversampling) with a 2048 x 64 backthinned Hamamatsu CCD, 50 micron entrance slit, 1200 lines per mm grating, and fed light by a 400 micron core diameter fiber optic cable. The fiber optic cable obtains light from the sun, moon, or sky from front-end optics with a 2.2O field of view (FOV) for direct-sun observations using a diffuser and 1.6O FOV for sky observations without a diffuser. The optical head uses a double filter wheel containing 4 neutral density filters, a UV340 filter, ground fused silica diffusers, and a blocked position. When combined with the variable exposure time (4 – 4000 ms), Pandora has a dynamic range of 107 to 1, which is sufficient for viewing both direct sun and sky, and for measuring the dark current in between each measurement. Wavelength calibration is performed at several spectrometer temperatures using a variety of narrow line emission lamps that cover most of the spectral range 280 - 525 nm. From the laboratory data, a polynomial is fitted to the results as a function of pixel column number 1 – 2048. Wavelength calibration was validated using comparisons with the slit function convolved high resolution Kurucz spectrum's solar Fraunhofer lines. Based on laboratory measurements, the Avantes spectrometers are corrected for response nonlinearity to the incoming signal, which can amount to 3% at high counts and is negligible at low counts. The exposure times to sun or sky photons are adjusted so that the readout pixel with the highest intensity is never in excess of 80% of the CCD readout well depth of 200,000 electrons. This means that each pixel in the 64 rows for each wavelength is limited to less than 2500 electrons. The laboratory calibrated Pandora TCO retrieval algorithm uses an external solar reference spectrum derived from a combination of the Kurucz spectrum (wavelength resolution λ/Δλ = 500,000) radiometrically normalized to the lower resolution shuttle Atlas-3 SUSIM spectrum (Van Hoosier, 1996; Bernhard et al., 2004). Ozone absorption cross sections (BDM) are from Brion et al. (1993; 1998) and Malicet et al. (1995). The use of a well calibrated top of the atmosphere TOA spectrum convolved with the laboratory measured spectrometer slit function derived for each pixel permits derivation of ozone amounts without resorting to either a Langley calibration approach or calibration transfer from a standard instrument. The core slit function is known to within 1%, which propagates into an ozone error of less than 1%.
Bernhard G., C. R. Booth, J. C. Ehramjian, Version 2 data of the National Science Foundation's Ultraviolet Radiation Monitoring Network: South Pole, J. Geophys. Res., 109, D21207, doi:10.1029/2004JD004937, 2004.
Brion, J., Chakir, A., Daumont, D., Malicet, J., and Parisse, C., High-resolution laboratory absorption cross section of O3 Temperature effect, Chem. Phys. Lett., 213, 610–612, 1993.
Brion, J., Chakir, A., Charbonnier, J., Daumont, D., Parisse, C., and Malicet, J., Absorption spectra measurements for the ozone molecule in the 350–830 nm region, J. Atmos. Chem., 30, 291– 299, 1998.
Malicet, J., D. Daumont, J. Charbonnier, C. Parisse, A. Chakir, and J. Brion, "Ozone UV spectroscopy. II. Absorption cross-sections and temperature dependence," J. Atmos. Chem. 21, 263-273, 1995.
Van Hoosier, M.E., The Atlas-3 solar spectrum. Available via anonymous ftp at ftp://susim.nrl.navy.mil, 1996.
Introduction
What does Pandora Measure?
O3
HCHO
BrO
NO2