Altitude Profiles of NO2 and O3
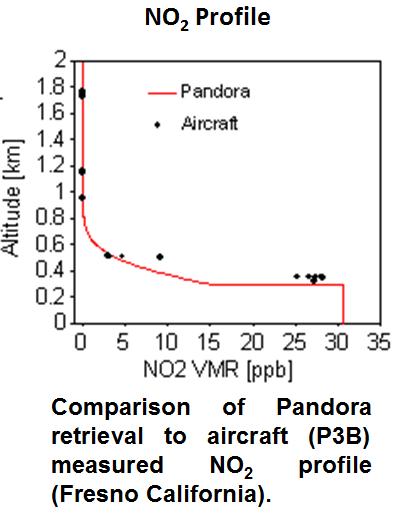
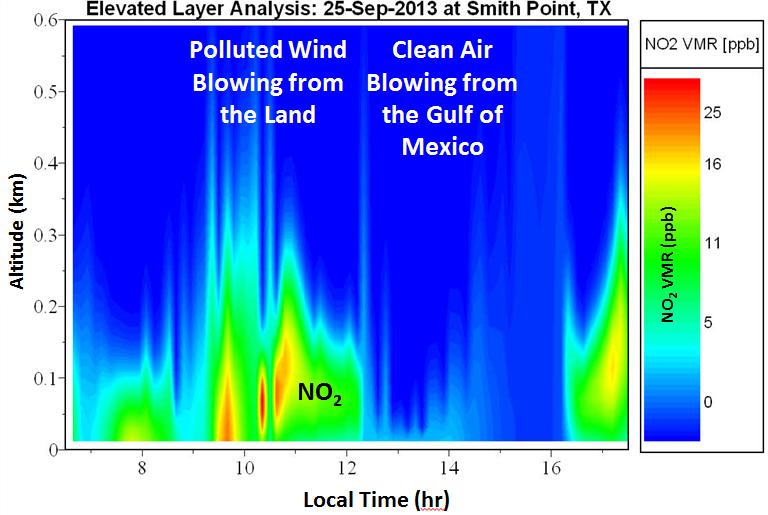
Work on obtaining altitude profiles was performed during the DISCOVER-AQ campaigns by scanning the sky from the horizon to zenith. Examples of profile retrievals are shown from the Texas campaign at Smith Point (see map) for ozone and NO2. The NO. curtain plot shows the behavior of NO2 mixing ratio (ppb) during the day of 25 Sept 2013 responding to onshore and offshore winds. The vertical resolution is better than 50 meters. Also shown is a comparison of a Pandora NO2 profile with aircraft data obtained over Fresno, California.
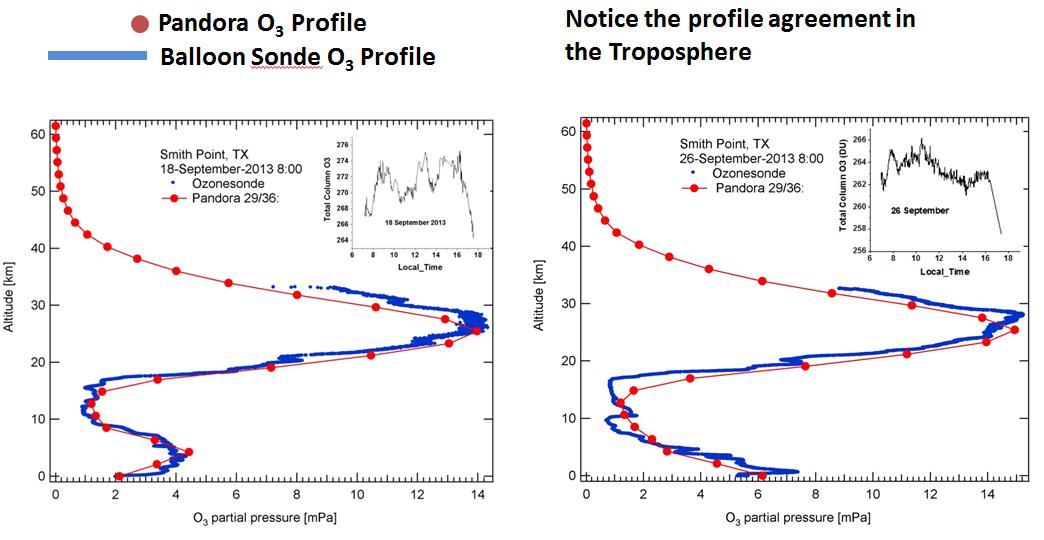
The ozone data at Smith Point, Texas from 18 Sept and 26 Sept 2013 are compared to coincident balloon sonde data. The inset in the upper right corner shows the time dependence during the day of the total O3 column amount (Dobson Unit: 1 DU=2.69x10¹⁶ molecules/cm2). Of note is the fact that the troposphere (0-20 km) is quite different between the two days, yet the Pandora retrieval follows the basic balloon-sonde measured profile. Stratospheric O3 is measured during the mornng and evening at moderately high solar zenith angles SZA. Averaging kernels show good sensitivity to the stratosphere and the boundary layer at high SZA. During mid-day (lower SZA) the sensitivity is in the troposphere, permitting a profile measurement every 10 to 20 minutes.
Altitude Profiles of NO2 and O3
Work on obtaining altitude profiles was performed during the DISCOVER-AQ campaigns by scanning the sky from the horizon to zenith. Examples of profile retrievals are shown from the Texas campaign at Smith Point (see map) for ozone and NO2. The NO2 curtain plot shows the behavior of NO2 mixing ratio (ppb) during the day of 25 Sept 2013 responding to onshore and offshore winds. The vertical resolution is better than 50 meters. Also shown is a comparison of a Pandora NO2 profile with aircraft data obtained over Fresno, California.
The ozone data at Smith Point, Texas from 18 Sept and 26 Sept 2013 are compared to coincident balloon sonde data. The inset in the upper right corner shows the time dependence during the day of the total O3 column amount (Dobson Unit: 1 DU=2.69x10¹⁶ molecules/cm2). Of note is the fact that the troposphere (0-20 km) is quite different between the two days, yet the Pandora retrieval follows the basic balloon-sonde measured profile. Stratospheric O3 is measured during the mornng and evening at moderately high solar zenith angles SZA. Averaging kernels show good sensitivity to the stratosphere and the boundary layer at high SZA. During mid-day (lower SZA) the sensitivity is in the troposphere, permitting a profile measurement every 10 to 20 minutes.
Optical improvments have been made during 2015 to remove spurious spectral signals arising from interference effects.
NO2 Altitude Profiles at Smith Point. Texas Fresno, Californiaublo edit
Ozone Altitude Profiles at Smith Point, Texas